One of the main inconveniences with Ansible Controller is that while every playbook that it runs is logged, boiling those logs down to just the data you need in a usable format can be difficult. There is no real way of customizing the reporting built into the system, so instead you are generally expected to buy another 3rd Party tool (some of the recommendations can be super expensive) to export to and build reports out of the data. This might not be a tenable solution for a lot of people, so today we will explore ways of utilizing Ansible with the Ansible Controller API to pull the data we need and build our own reports.
We will start with a simple scenario.
“I have multiple playbooks that I periodically run against my hosts, but I only want a report on hosts where something was changed and for it to tell me what actually changed in a usable format (csv file or html).”
This is a very common scenario that I see a lot. Customers have a Security Hardening playbook that they run daily via a schedule against their hosts, and they just want to be alerted if something is out of Compliance. If Ansible Controller would just allow you to create a notification on “Changed” this could be a bit easier, but alas it only allows for notifications on Success or Failed. So instead we are going to replicate this concept ourselves. As with most things in Ansible, there are many routes we could take to accomplish this. For our purposes, since we may have an infinite number of playbooks that we may want to do reporting against, it makes the most sense to make any reporting we do agnostic to the original playbook itself. Instead we will create all the reporting in its own playbook, and just point it at the Job we want to report against (or include it in somehow). Again there are multiple ways we could do this, but the simplest way would be to utilize Workflows. Workflows allow us to have playbooks that run after each other. This allows us to do that “pointing” via a very easy method. As an example, our simple Workflow may look like this. The first node is our Security Hardening Job Template, while the last node is the Reporting Job Template.
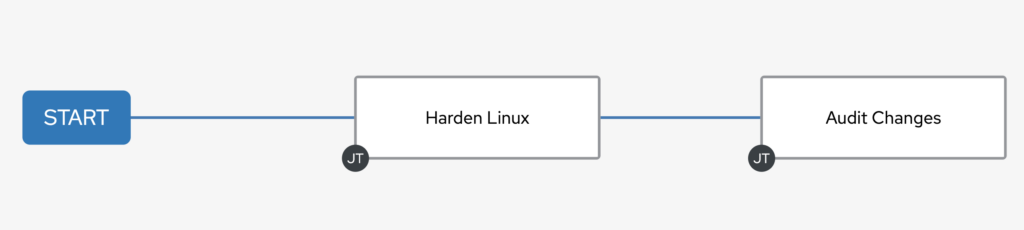
Instead of scheduling the individual Job to run, we will schedule this Workflow to run which will now include in our Reporting.
When running jobs in a Workflow, each node receives a few special variables from Controller. We will be utilizing one such variable, tower_workflow_job_id, to call the Controller API and pull the full listing of jobs that are running in that workflow. From there, this will allow us to look up the job and all it’s events to create our report. So now we will start building out our playbook.
To start with, since we know we will be running this from Controller and accessing the API, you will want to create a Credential of the Type “Red Hat Ansible Automation Platform” and fill it out with our access to our Controller. We will then pull those credentials into variables to make them easier to use later (as we won’t be using the Ansible Controller modules). We will also add a few variables to determine the max amount of data we want to pull (to reduce load on the Controllers).
- name: Check previous job for change entries
  hosts: localhost
  gather_facts: no
  connection: local
  vars:
    tower_server: '{{ lookup("env", "TOWER_HOST") }}'
    tower_username: '{{ lookup("env", "TOWER_USERNAME") }}'
    tower_password: '{{ lookup("env", "TOWER_PASSWORD") }}'
    max: 50
    page_size: 200
So before we start building out our report, we need to set a few thing up. We will be doing this in our pre_tasks to accomplish this. While putting these in pre_tasks isn’t necessary for this playbook as we are just running against localhost; I have other reporting playbooks that run against their separate hosts, so I try to be consistent across all of them. The first thing we want to check is whether our special variable exists, if not that means either someone ran the Job Template by itself, or from the command line, and we don’t want that. Next we will be assembling our reports from multiple files, so we will want to build out a directory structure for this temporary location they will be created. If running a version of Controller that contains Execution Environments, then the 3rd task isn’t necessary (as it will always be empty).
  pre_tasks:
    - name: Precheck
      ansible.builtin.assert:
        that:
          - tower_workflow_job_id is defined
          - tower_workflow_job_id > 0
        fail_msg: "This playbook must be ran from a workflow within Controller"

    - name: Ensure Reports directories exist
      ansible.builtin.file:
         state: directory
         path: "{{ playbook_dir }}/reports/fragments/"
      delegate_to: localhost
      run_once: true

    - name: Ensure fragments directory is empty
      ansible.builtin.file:
         state: absent
         path: "{{ playbook_dir }}/reports/fragments/*"
      delegate_to: localhost
      run_once: true
Now that we are setup, we can start writing the main portions of our playbook. Our first task is going to be using the URI module. Take note that we aren’t using the Controller modules for this. While they are good for creating or changing things, they aren’t very handy for pulling data. There is a Controller API lookup plugin that can be used, but it can be a bit confusing to newcomers. So in our first task, we will be connecting to the API using our special variable (and our Tower credential variables we setup) and will pull all the nodes for the workflow.
In the second task, I don’t expect you to fully understand what is happening, but I am reverting to the Jinja2 language to parse the data we received and looking through it to find the Job ID that is not currently running (because that is the Audit job) and that has a type of “Job” (so it doesn’t grab a Project Syncs, etc… if we had that in our Workflow). In the end, this will give us the Job ID of the Hardening Job that ran before our current Audit run. I use the Jinja2 language a lot in my playbooks. YAML itself is not a programming language, so Jinja2 allows me to do some very complex stuff in a single task, while doing the same in YAML with modules would require multiple tasks.
Once we have the Job ID, we will want to pull the events of that Job run. Here we will add some limits to what is pulled so that we get only what we need and don’t put excessive load on the Controller. So again we use the URI module and we set the URL parameter to include some flags to tell it to only pull events that were task executions that made a change. This should give us exactly the events that we want to look at. We are setting the page size to the maximum though (via the variable above) but we still may receive multiple pages, so we will have to account for that possibility.
  tasks:
    - name: Get the Job ID for the first playbook run
      ansible.builtin.uri:
        url: https://{{ tower_server }}/api/v2/workflow_jobs/{{ tower_workflow_job_id }}/workflow_nodes/
        method: GET
        user: "{{ tower_username }}"
        password: "{{ tower_password }}"
        body_format: json
        validate_certs: False
        force_basic_auth: yes
        status_code:
          - 200
      register: response

    - ansible.builtin.set_fact:
        job_id: "{%- set job = namespace(job=0) -%}\
                 {%- for c in response.json.results -%}\
                   {%- if c.job != tower_job_id and c.summary_fields.job.status != 'running' and c.summary_fields.job.type == 'job' and c.job > job.job -%}\
                     {%- set job.job = c.job -%}\
                   {%- endif -%}\
                 {%- endfor -%}\
                 {{- job.job -}}"

    - name: Get the Job Results for the first playbook run
      ansible.builtin.uri:
        url: https://{{ tower_server }}/api/v2/jobs/{{ job_id }}/job_events/?event=runner_on_ok&changed=true&page_size={{ page_size }}
        method: GET
        user: "{{ tower_username }}"
        password: "{{ tower_password }}"
        body_format: json
        validate_certs: False
        force_basic_auth: yes
        status_code:
          - 200
      register: jdata
Before we start building the actual report, we want to do a quick check first and ensure that we need to. If we didn’t find any changes, then there is no reason to continue on. So here we will display a message (nobody likes a playbook that just stops without warning) and then will use the meta module to end the play run. I prefer using the meta module instead wrapping the rest of the playbook in a block and using a when statement.
    - ansible.builtin.debug:
        msg: No Changes were detected
      when: jdata.json.count == 0

    - name: End Play if no changes
      ansible.builtin.meta: end_play
      when: jdata.json.count == 0
Now we are going to start writing the report files. First we are going to create a quick variable to tell us how many pages we need to pull, and another to tell us what page to start on. Now this may seem like common sense, but since the data is stored in reverse order in the API, we want to make sure we are getting the newest data if it was going to exceed our maximum pull size, so we might not be starting on Page 1 (Page 1 has the oldest data). Ideally since we are pulling changes for a single job here and really want all the data, we shouldn’t be limiting ourselves. I included this concept in here so you will understand how to do it in other reports. I have other playbooks that look at all the jobs at once, and parse them, so it is an important concept to keep in mind.
Now that our variables are set. We need to loop and pull each page one at a time. We will use the include_tasks module to handle this with the range filter, and will set the loop variable to the page number we are pulling.
    - name: Set Page Count
      ansible.builtin.set_fact:
        pages: "{{ ((jdata.json.count / page_size) | round(0, 'ceil') | int) + 1  }}"

    - name: Set Start Page Count
      ansible.builtin.set_fact:
        start: "{{ 1 if pages|int < max|int else ((pages|int) - (max|int)) }}"

    - name: Loop over the event pages backwards
      include_tasks: tasks/event_tasks.yml
      loop: "{{ range(start|int, pages|int) | list }}"
      loop_control:
        loop_var: page
In the tasks/event_tasks.yml file, we will use 2 simple tasks to build out the report page by page. We will first use the URI module again to pull the events in the particular page. We will then use the template module to build the report for that page’s events.
- name: Get the events on page {{ page }}
  ansible.builtin.uri:
    url: https://{{ tower_server }}/api/v2/jobs/{{ job_id }}/job_events/?event=runner_on_ok&changed=true&page_size={{ page_size }}&page={{ page }}
    method: GET
    user: "{{ tower_username }}"
    password: "{{ tower_password }}"
    body_format: json
    validate_certs: False
    force_basic_auth: yes
    status_code:
      - 200
  register: events

- name: Create report of changes on page {{ page }}
  ansible.builtin.template:
    src: templates/changes.html.j2
    dest: "{{ playbook_dir }}/reports/fragments/page-{{ page }}.html"
The template may look a bit complex, as we have a lot of data to loop through, and need to determine which parts of it to display. For our purposes, we will utilize the Date, Hostname, Playbook Name, Task Name, Module, and a Diff of what was changed. For your Hardening Template, if you checked the “Show Changes” box, your Job output will display a nice Diff of what was changed. In the API though, you don’t get the diff just the raw data of the before and after of the changes. You don’t get all this data if you don’t have “Show Changes” enabled, so if you want it, it is important to ensure you enable it. This is way too much data to display on its own though, so for my own playbook, I hacked together a lookup plugin that allows me to do diffs with html output for the colors. You can find it posted in my repo later in the article. We are also going to convert it all to YAML so that it displays a bit nicer in our report.
{% for c in events.json.results %}

<tr><td>{{ c.modified[:19] | replace("T", " ") }}</td><td>{{ c.host_name }}</td><td>{{ c.playbook }}</td><td>{{ c.task }}</td><td>{{ c.event_data.resolved_action }}</td><td><pre>
{% if c.event_data.res.diff is defined %}
{% for d in c.event_data.res.diff %}
{% if d.before_header is defined and d.before is defined %}
{{ lookup('diff', before=d.before, after=d.after, header=d.before_header) | default("") | to_nice_yaml(width=1337) | replace ("\\n", "\n") }}
{% else %}
{{ d | default("") | to_nice_yaml(width=1337) | replace ("\\n", "\n        ") }}
{% endif %}
{% endfor %}
{% endif %}
</pre></td></tr>

{% endfor %}
Now that our report files are created, we need to combine them all back together, so we will use the assemble module to accomplish this. Now if we were creating a CSV file, we would append just a header containing the columns names to the file. As we will be creating an HTML report, we will want both a header and a footer. We will use the lineinfile module to accomplish this.
 post_tasks:
    - name: Concat all the html files
      ansible.builtin.assemble:
        src: "{{ playbook_dir }}/reports/fragments/"
        dest: "{{ playbook_dir }}/reports/changes.html"

    - name: Append the header to the html file
      ansible.builtin.lineinfile:
        dest: "{{ playbook_dir }}/reports/changes.html"
        insertbefore: BOF
        line: "{{ lookup('ansible.builtin.template', 'templates/header.html.j2') }}"

    - name: Append the footer to the html file
      ansible.builtin.lineinfile:
        dest: "{{ playbook_dir }}/reports/changes.html"
        insertafter: EOF
        line: "{{ lookup('ansible.builtin.template', 'templates/footer.html.j2') }}"
The header.html.j2 file will look like this
<html>
  <head>
    <style>
      body { background-color: #efefef; }
      table { border-spacing: 0px; }
      table, th, td { border: 1px solid #ccc;  background-color: white;}
      th { background-color: #ccc; font-weight: bold; }
      td { padding: 10px; }
    </style>
  </head>
	<body><center><br><h3>{{ jdata.json.results[0].summary_fields.job.name }}</h3><br><br>
    <table>
      <tr><th>Date</th><th>Server</th><th>Playbook</th><th>Task</th><th>Module</th><th>Change</th></tr>
and the footer.html.j2
</table></center></body></html>Now we just need 1 task to complete our playbook, and that is just sending out the report we built. We will be sending this out via Email, so we use the mail module. I am specifying 4 variables here that we did not define early, and that is because I typically set these variables in the Workflow Extra Vars, so that I can email each report to different users as needed (it could also be survey questions, etc…). In the body of the email, we will include both a link to the Workflow and the Job in our Controller.
- name: Mail Report
community.general.mail:
host: "{{ smtp_server | default('127.0.0.1') }}"
port: "{{ smtp_port | default(25) }}"
subject: Change Report - {{ jdata.json.results[0].summary_fields.job.name }}
body: |
Attached is the change report for <b>{{ jdata.json.results[0].summary_fields.job.name }}</b><br><br>
<a href="https://{{ tower_server }}/#/jobs/workflow/{{ tower_workflow_job_id }}/output">Workflow</a><br>
<a href="https://{{ tower_server }}/#/jobs/playbook/{{ job_id }}/output">Job</a><br>
from: "{{ from_address }}"
to:
- "{{ to_address }}"
attach:
- "{{ playbook_dir }}/reports/changes.html"
subtype: html
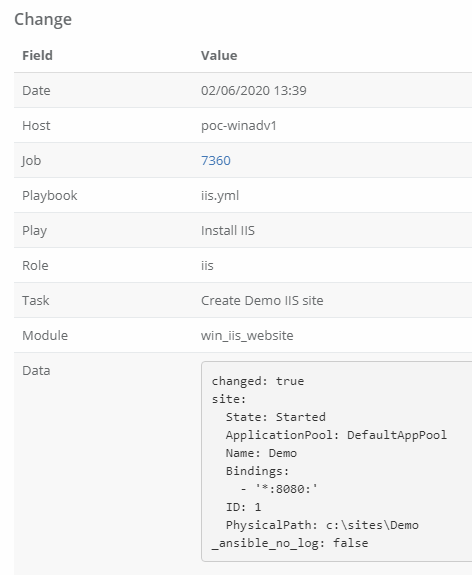
ignore_errors: trueThe results from the report we receive will then look something like this
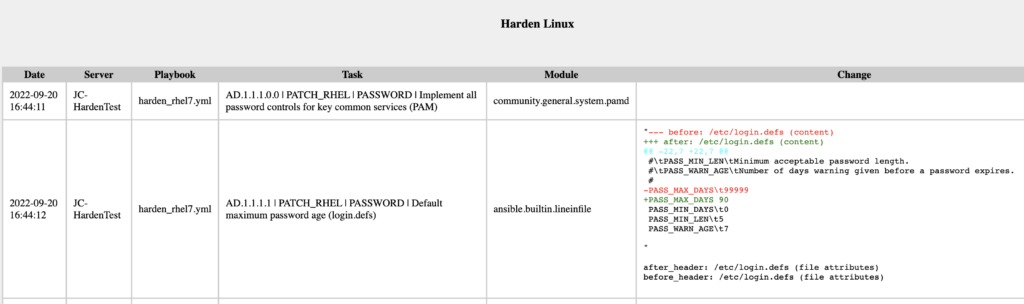
Here is a full example of the report ran against a test system.
You can find the full playbook including the Lookup Plugin on my Github repo located here
https://github.com/cigamit/ansible_misc/tree/master/change_audit